Businesses no longer collect clickstream data with Google Analytics 4 (GA4) exclusively to enable data-informed decision-making by inspecting and analyzing the captured user data, assessing marketing campaign performance, or reporting on the most valuable landing pages. Companies that want to drive tangible business value use it as a data collection tool that feeds their marketing platforms with conversions and valuable audiences.
This has always been the case, but with the advent of GTM Server-Side (sGTM) and its expanding capabilities, this integration becomes more profound.
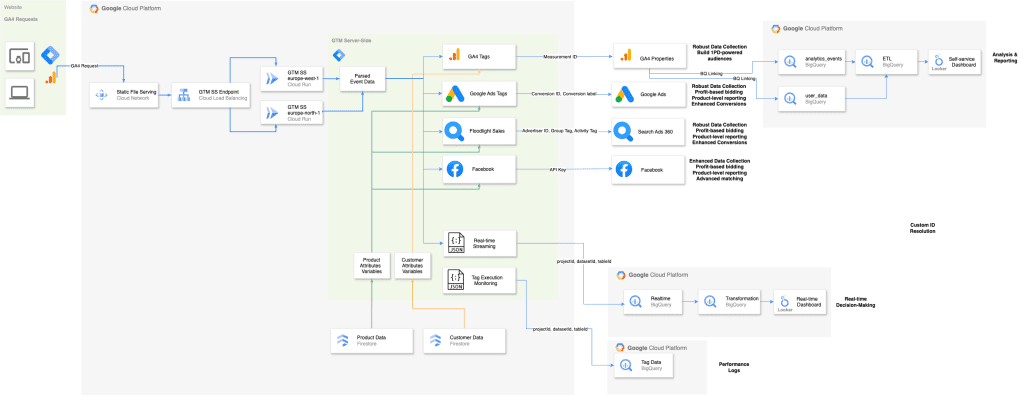
As illustrated in the above visualization, businesses are migrating their data collection for services like Google Ads, Meta, Floodlight, and others from their client-side to server-side containers. This shift offers significant benefits, including additional data controls, optimized page load speed, and the option to enrich data streams with first-party data in real time. This enhanced data collection strategy opens up possibilities for custom solutions like real time dashboards and personalized communication.
While the shift to GA4 and sGTM is a positive step that can potentially enhance digital marketing performance (read one of our cases on how to leverage sGTM to improve marketing performance here), it also brings a new challenge that has, so far, slipped the minds of those rushing to adopt this approach. The increasing number of vendors and tools relying on a single GA4 data stream highlights the critical importance of accurate data collection. Businesses must prioritize data quality to ensure the effectiveness of their digital marketing strategies.
The Traditional QA Flow: A Recipe for Losing Trust
The complexity and risks associated with the dominating approach become apparent when we examine the current state of data quality assurance (QA) within organizations.
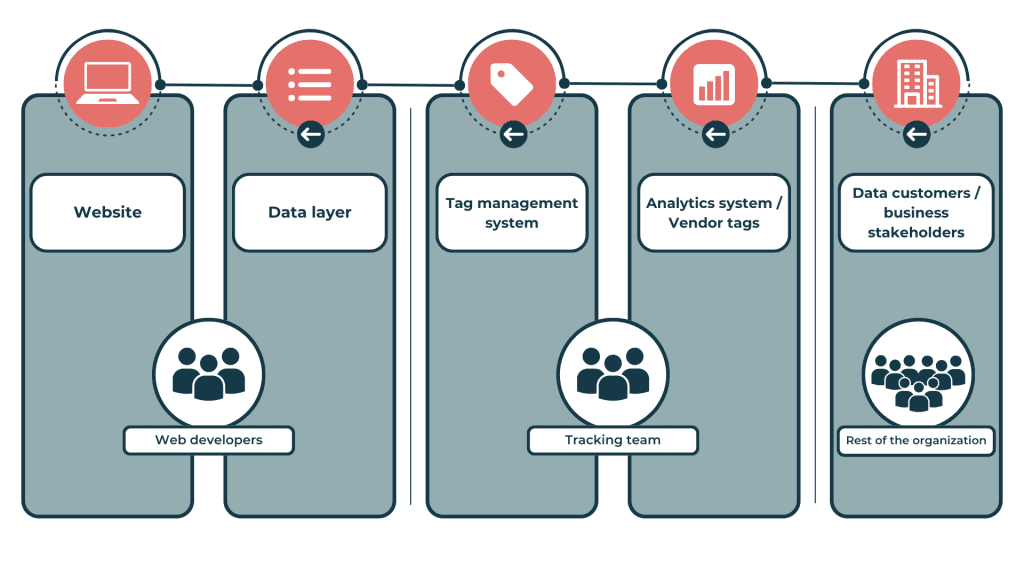
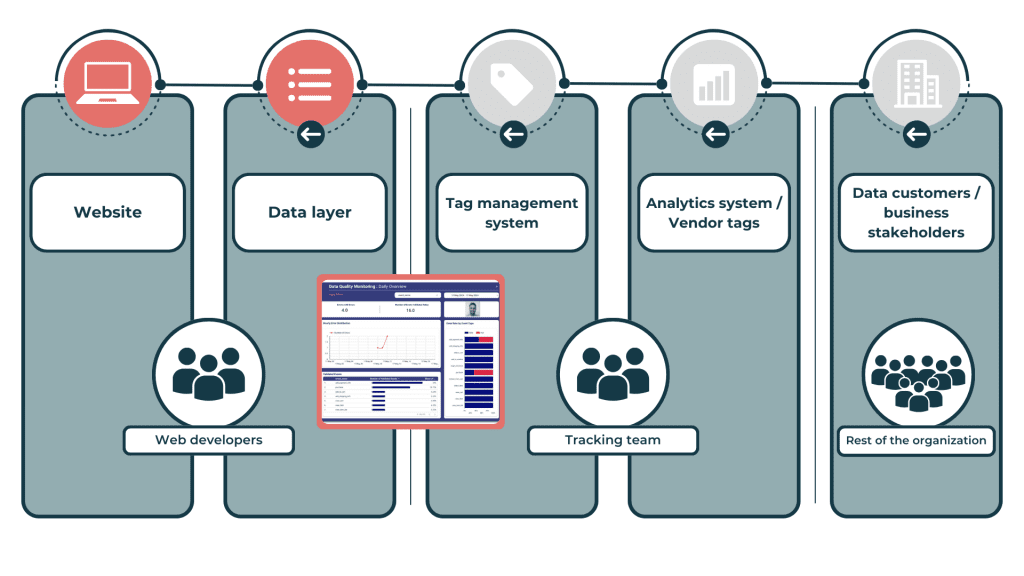
The traditional QA process for GA4 data collection, as well as measurement implementations for other marketing vendors, involves multiple departments and various layers – as you can see from the figure below. Usually, website developers and the measurement team collaborate on the dataLayer specifications and its implementation. The exposed events and associated values power the tag management system (e.g., Google Tag Manager), where the GA4 tags are configured to fire, read the desired values, and dispatch them to the GA4 servers. Eventually, the processed data is made available to a wide range of data consumers and decision-makers within the organization via the GA4 UI or dedicated dashboards.
When no GA4 data quality measures are in place, the data recipients usually identify data inconsistencies and report their findings upstream to you and your colleagues in the measurement team. If you’ve ever gotten a call or an email pointing out discrepancies in your data collection while you were getting ready for the weekend, you can relate to how this can ruin your weekend plans (or at least I can). Once you receive this message, the work begins: Your team investigates whether they can confirm the issue or if the recipients lack context or training. If they confirm the issue, they need to identify the source—most probably by trying to replicate it. In the process, they need to communicate with the data consumers and web developers before the culprit is identified and eventually resolved.
You can see how frustratingly cumbersome this process is. However, it’s still how most companies operate out there. With such a long QA flow, errors can spread quickly, impacting multiple areas before detection. Furthermore, the involvement of various departments increases response times, delaying error resolution. Inadequate tools often hinder efficient debugging at scale.
The consequences of these shortcomings are severe:
- Delayed Insights: Errors found by data consumers often mean that the data has been incorrect for a period, leading to delayed or misguided insights
- Reduced Trust: Repeated errors discovered by end-users can erode trust in the analytics platform, making stakeholders less confident in the data
- Increased Workload: Data consumers, tracking teams, and development teams all face increased workloads to identify, report, and fix issues, which can divert resources from more strategic initiatives
- Operational Inefficiency: Finding and fixing errors post-collection leads to operational inefficiencies
Moving from Reactive to Proactive Data Quality Monitoring
To overcome the issues of this reactive approach, you, as a responsible member of your tracking team, should develop proactive measures that catch errors as early as possible before they manifest and are exposed as facts to your data consumers. Therefore, let’s explore some of the options we have at our disposal, spanning from built-in GA4 features to leveraging the BQ raw data exports to deploying a custom validation endpoint in the following section.
Leveraging GA4 Insights
GA4 has a built-in insights feature that can automatically detect changes in your data. By setting up custom alerts (yes, letting go of good ol’ UA terminologies is hard), you can monitor essential data changes and receive email notifications when certain defined conditions are met. For example, you can create alerts for significant drops in active users or purchase events, ensuring timely interventions.
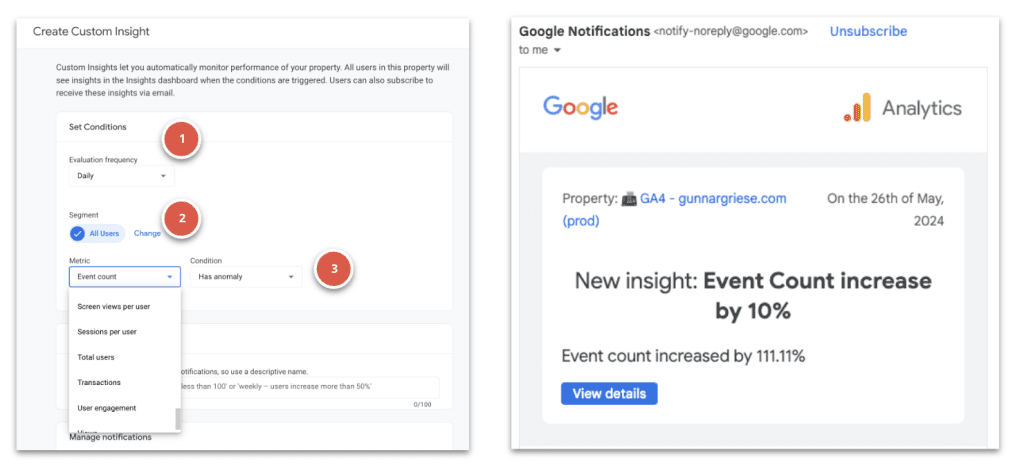
The configuration is simple and allows for quite some flexibility:
- Evaluation frequency: Hourly (web-only), Daily, Weekly, Monthly
- Segment: All Users is the default segment. Change to select other dimensions and dimension values. Specify whether to include or exclude the segment
- Metric: Select the metric, condition, and value to set the threshold that triggers the insight. For example: 30-day active users – % decrease by more than – 20. If you choose Has anomaly for the condition, GA4 determines when the change in the metric is anomalous, and you do not need to enter a value
Having the ability to set up these notifications is a good step in the right direction, as it increases the chances that the measurement team catches errors in the data collection mechanism instead of putting this task on the data consumers. By moving the quality assurance closer to the source, we gain valuable time and control over addressing these issues (especially from a communication perspective to our end users).
The custom insight feature is excellent for detecting unexpected fluctuations (=data volume) in relevant metrics, and most importantly, it’s free. Still, it falls short of addressing potential data quality issues. To do so, we would need much more granular configuration options to allow us to perform checks on event level.
Stepping up our game with BigQuery and Dataform
I am not the first one to tell you this, but here it goes: Exporting your GA4 raw data to BQ will help you get the most out of your GA4 data. In this case, it’s our gateway to implementing powerful data quality checks for our data.
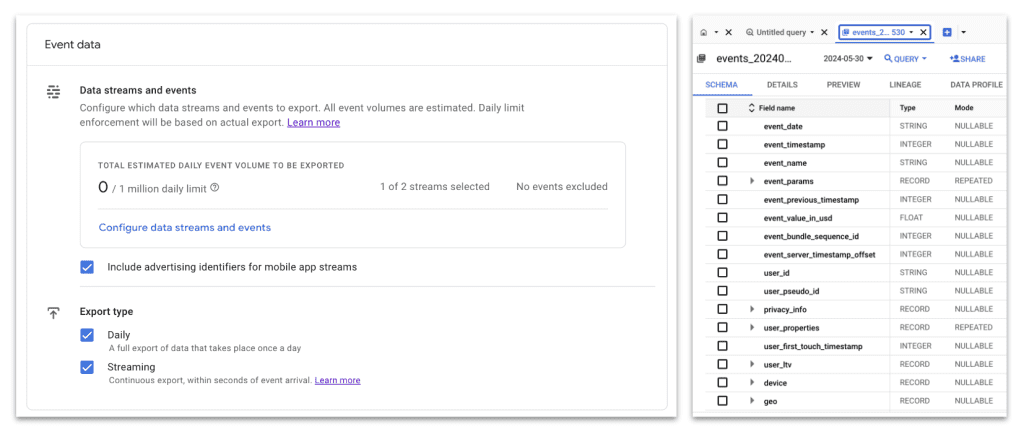
Integrating BigQuery with your GA4 setup allows you to implement custom evaluation rules using SQL – limited only by your imagination. This integration turns BigQuery into a powerful tool for data quality monitoring.
Using SQL in BigQuery, it is possible to develop custom rules to evaluate your data. For instance, you might set up rules to validate event data structures, ensuring they meet your predefined standards. To give you some inspiration:
- Are all the expected ecommerce events being tracked?
- Do all of these events have an item array associated with at least one item?
- Do all items have an item ID, quantity, and value?
- Do all purchase events have a transaction ID (in the expected format), and is the purchase revenue larger than 0?
- Etc.
It’s up to you to package your business logic into an SQL query that calculates the share of “falsy” events and identifies patterns as to why this is happening (e.g., specific page paths or browsers). Now, you might ask yourself: Do you really expect me to run such a query at the end of each day before I head home?
No, not necessarily. You can use Dataform to further enhance this by allowing you to build and operationalize scalable data transformation pipelines. In particular, Dataform will enable you to alleviate the work of scheduling and evaluating the data quality query results. Dataform easily allows you to schedule queries and implement validations on top of query results using assertions.
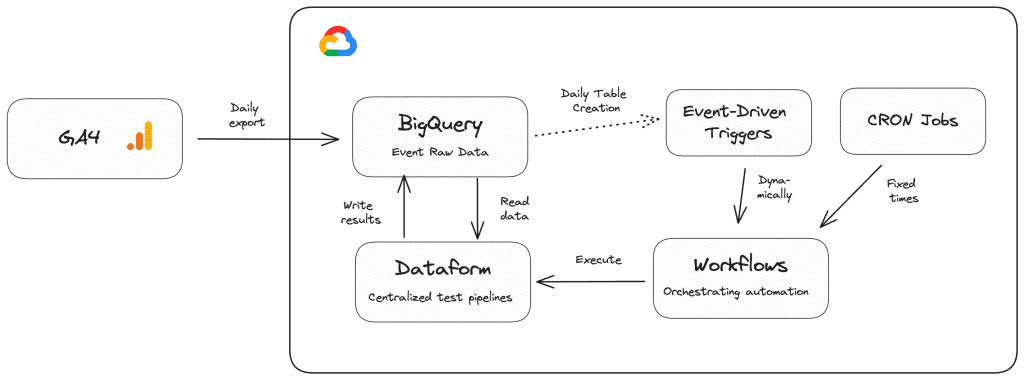
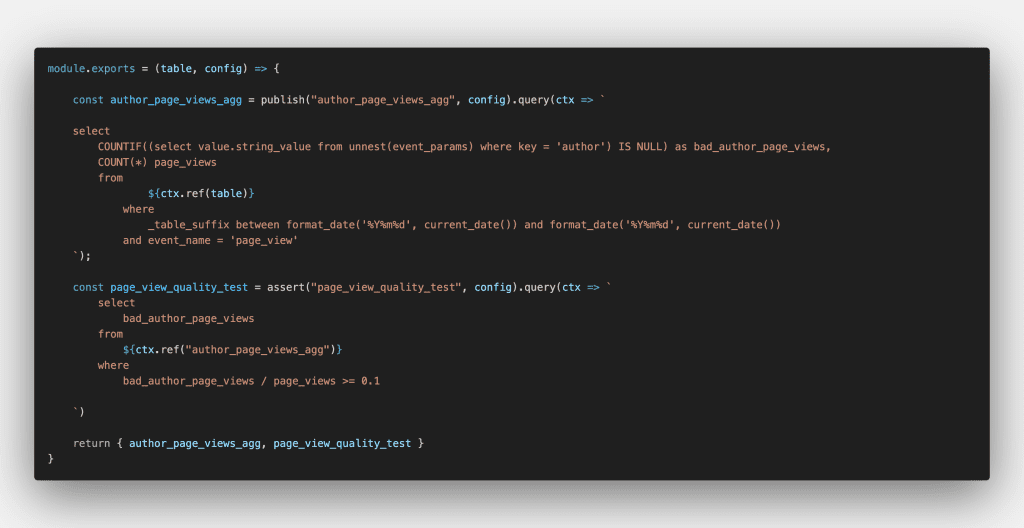
For example, in the below Dataform configuration, I am querying the page views from my blog where the custom dimension author is not populated. Furthermore, I’m specifying a rule that the share of these “bad” page views should not be more than 10% of all measured page views using Dataform’s assert function.
As many of you might be using Dataform already in their workflows to automate the creation of aggregated datasets for reporting, adding data quality assertions to the mix comes with minimal additional work but ensures you and your team deliver high-quality data to your end users. If you haven’t looked into Dataform yet, I highly recommend checking it out – don’t miss out on a huge time saver.
Data Validation in Realtime
But wouldn’t it be even better, if we could somehow move the data quality evaluation up to the point where the data actually originates from and thereby enable realtime monitoring for all the events we collect? If this were the case, we could act even faster on errors and fix bugs before multiple days of data are compromised. We could steer the communication around how to deal with these errors. We could even decide what to do with this erroneous data before it enters any downstream systems (- remember the first visual of this article?).
You see, the benefits of such a real-time validation are tremendous, and it can enable a much more streamlined QA process for our GA4 data.
The concepts of schemas and data contracts
The GA4 data collection for websites naturally originates from our users’ browsers when they visit our website. We then enable tracking for relevant user interactions via the website’s dataLayer (especially for ecommerce tracking) and use the dataLayer events to fire our GA4 event tags, which also pick up metadata according to the tags’ configurations. Eventually, the events and associated data are dispatched via requests directly to GA4 servers or our own sGTM container for further processing.

As the overview above illustrates, all three GA4 data sources at the core consist of objects and key-value pairs that describe a given purchase event and its properties. Hence, we can think of every GA4 event as a JSON object that contains all necessary information about it for it to be processed in GA4.
The above JSON contains information about a specific event but omits details that can lead to certain limitations when sending it to GA4. For instance, the above JSON objects might be:
- Unclear: The examples don’t tell us which fields are required or optional, or what their respective types are. E.g., we do not know if the transaction ID field should always be a string or a number. Additionally, if it should be a string, we do not know its format. Should the transaction_id always start with a “T-” like in the example?
- Incomplete: JSON objects lack complete data context, such as whether an item object should include an item_id or item_name field, and it does not indicate which fields can be omitted.
- No Enforcement: JSON objects lack standardized validation and constraints, so it can’t enforce rules like an event requires a user_id if the login_status equals “loggedIn” or the item_category value being from a predefined list.
For the standard GA4 events, Google provides us with extensive documentation of required key-value pairs and the values’ types. Furthermore, if you’ve been serious about your data collection in the past, you can rest assured that you have documentation about custom events and associated parameters as well.
The need to validate an instance of a JSON object against a predefined set of rules that this object should adhere to is luckily nothing new in programming and has been solved already. One of the most effective ways to ensure data consistency and validity is through JSON Schemas. JSON Schema is a blueprint for JSON data that solves all of the issues listed. It defines the rules, structure, and constraints that the data should follow.
JSON Schema uses a separate JSON document to provide the JSON data’s blueprint, which means the schema itself is also machine and human-readable. Or to rephrase it, we are using JSON to describe JSON.
Let’s take a look at what the schema for our example dataLayer purchase event above could look like:
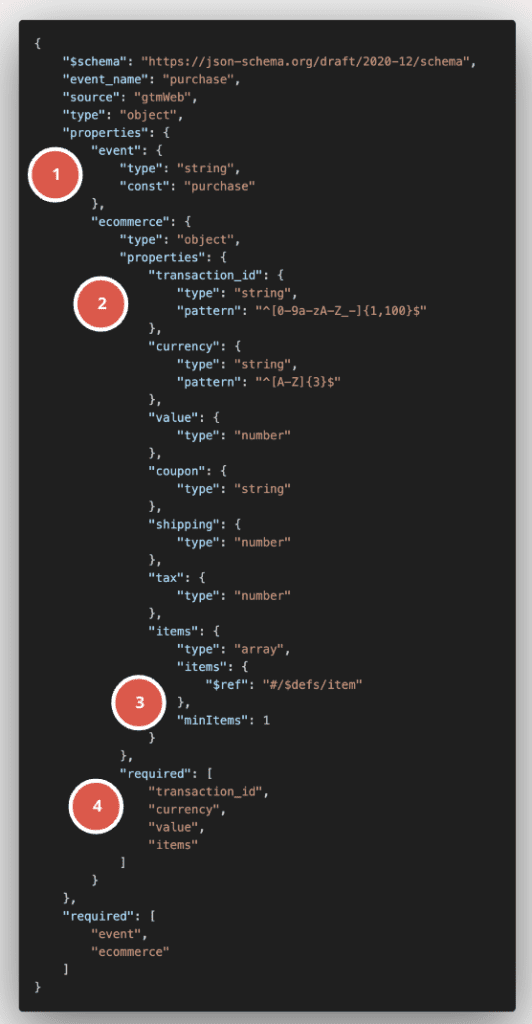
As you can see, the schema above provides a lot more context to our initial purchase dataLayer object, among others:
- Allowed values
- Pattern constraints (RegEx validation)
- List validation (e.g., minimum amount of objects in a list)
- Key validation (e.g., must have key-value pairs in an object)
This schema then functions as a sort of data contract that every GA4 event or dataLayer object needs to adhere to in order to be considered valid.
Monitoring a website’s dataLayer
With JSON schema in our toolbox and the full power of GCP at our disposal, we can now put all the pieces together by building a lightweight validation endpoint that is capable of receiving dataLayer event objects from the website and validating them against the schemas defined by you.
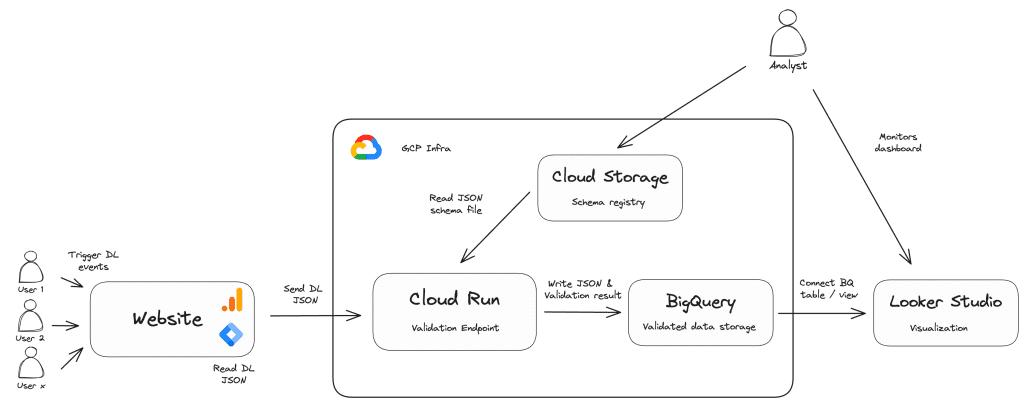
This requires a custom HTML tag in the website’s container that reads the desired dataLayer object and sends it as the payload to our validation application that could be hosted on Cloud Run, App Engine, or Cloud Functions. The application would read the schema definitions and compare these against the received dataLayer events. The results of this validation (e.g., valid or not, potential error messages, etc.) would be written to BigQuery or the logs of the application.
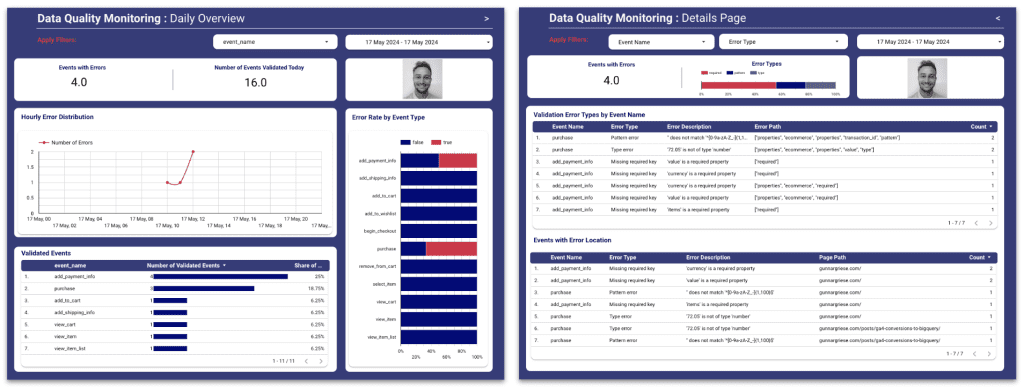
The resulting BigQuery tables enable a data quality cockpit that can be shared among all stakeholders – especially the measurement team and web developers responsible for the dataLayer implementation. The centralized dashboard can provide an overview of your data quality status, alerting you to potential issues and allowing you to take proactive measures.
Monitoring the GA4 event stream
If we are using sGTM for our GA4 data collection, we can integrate our custom validation endpoint with the container by using an asynchronous custom variable that forwards the event data object parsed by the GA4 client to the validator endpoint. The service will then respond with the validation result like below:

Having this information available before any data is made available to GA4 or any other downstream vendors like G Ads, Meta, or others allows for full control over how to treat events that are compromised:
- Should these events be dropped altogether?
- Should they be routed into a separate GA4 property for further investigation?
- Should compromised events be used to trigger marketing tags?
- Should the GA4 events simply be enriched with a data quality parameter?
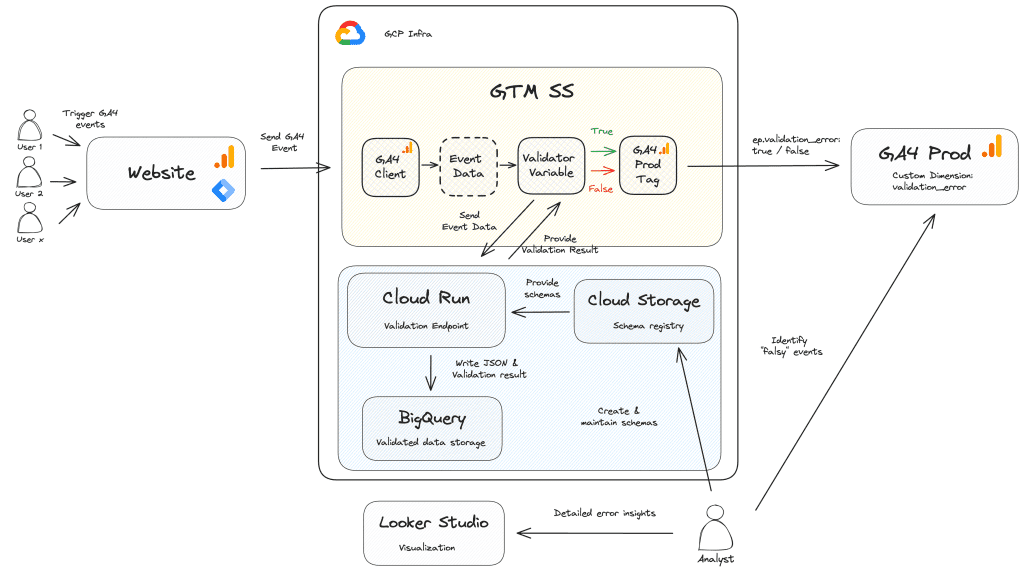
While the previous solution is great to monitor your data source and get notified when things break, using a direct integration with sGTM and enriching the GA4 data stream in realtime actually allows for enforcement of the data contract.
Benefits of Proactive Data Quality Monitoring
No matter what option you go for, proactive data quality right at the source of the data monitoring offers several significant benefits, ensuring that your analytics data remains accurate, reliable, and actionable.
1. Increased Trust in Data
When data is consistently accurate and reliable, stakeholders develop greater confidence in the analytics platform. This trust is crucial for making informed business decisions and strategizing effectively
2. Operational Efficiency
By catching errors early in the data pipeline, proactive monitoring reduces the need for extensive post-collection data cleansing and correction. This efficiency saves time and resources, allowing teams to focus on more strategic initiatives rather than firefighting data issues
3. Cost Savings
Identifying and fixing data quality issues early in the process is generally less costly than addressing them after they have affected downstream systems and reports. Proactive monitoring helps avoid the financial impact of poor data quality on business operations
4. Improved Decision-Making
High-quality data leads to better analytics and insights, which are critical for making sound business decisions. Proactive monitoring ensures that decision-makers have access to accurate and timely information, reducing the risk of making choices based on faulty data
Conclusion
Proactive data quality monitoring is not just a best practice; it is a necessity in the modern data landscape. By implementing robust monitoring and validation systems for their behavioral data collection in GA4, organizations can ensure the integrity of their data, build stakeholder trust, and maintain operational efficiency. The transition from reactive to proactive monitoring offers a strategic advantage, turning data quality management into a competitive differentiator.
Investing in proactive monitoring not only safeguards your data but also enhances your organization’s ability to make timely, informed, and impactful decisions.
For further assistance or to discuss how we can help you ensure data quality at scale, feel free to connect with us at IIH Nordic.

