
Are you a digital analyst looking to implement and debug Google Analytics tracking via Firebase for your mobile iOS apps and have no clue where to start? This blog post is for you! I’ll briefly walk you through the process of setting up Google Analytics tracking using both the Firebase SDK and Google Tag Manager (GTM). Primarily, I’ll cover the most effective debugging tools, including Charles Proxy and David Vallejo’s iOS/Android Debugger, to help you achieve accurate and reliable data collection.
Introduction to Google Analytics Tracking for Apps
Google Analytics 4 (GA4) marks the debut of a unified platform for tracking both web and mobile app data in Google’s analytics suite. This change acknowledges the increasing trend of businesses viewing their websites and mobile apps as interconnected, rather than separate sales channels. GA4 is designed to provide a more comprehensive understanding of user interactions across various platforms.
As GA4 integrates web and app analytics more closely, digital analysts must expand their knowledge of app tracking to fully leverage GA4’s potential. Traditionally, most digital analysts focused primarily on website measurement implemented via Google Tag Manager (GTM) or gtag.js.
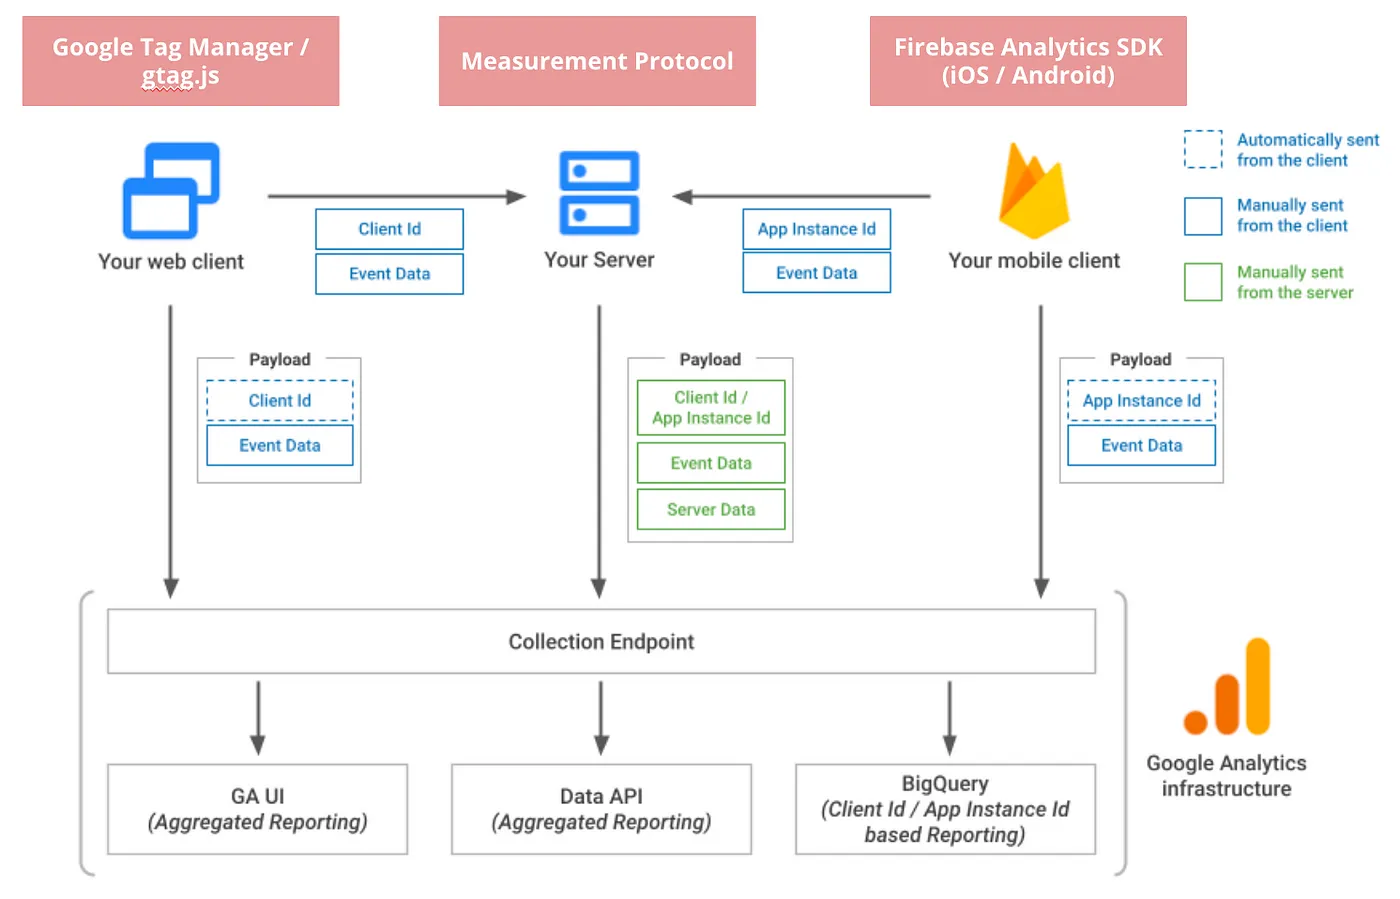
Source: https://developers.google.com/analytics/devguides/collection/protocol/ga4
However, implementing and debugging GA4 for apps significantly differs from the web-based approach and is more cumbersome.
There are two primary methods for enabling GA4 tracking in your mobile apps:
- Using the Firebase SDK exclusively
- Using the Firebase SDK in conjunction with GTM for Android/iOS
Firebase SDK
Firebase is a comprehensive app development platform offering various tools and services to help developers build, enhance, and grow their apps. With a direct integration into GA4 via the Analytics Software Development Kit (SDK), Firebase provides valuable insights into user behaviour and app performance.
{% include embed/youtube.html id=’8iZpH7O6zXo’ %}
By incorporating the Firebase Analytics SDK into your app, you can harness the power of Google Analytics 4 (GA4) to track user interactions, e-commerce actions, and other crucial metrics. Developers often prefer this approach, as it offers advanced data collection and analysis capabilities, along with additional Firebase features such as Cloud Messaging and Crashlytics.
Google Tag Manager for Apps
GTM offers two container types for native app tagging setups: Android and iOS, designed specifically for their respective app types. Both containers feature several tag types (mainly Google-specific), as well as limited trigger and variable capabilities compared to the GTM web container.
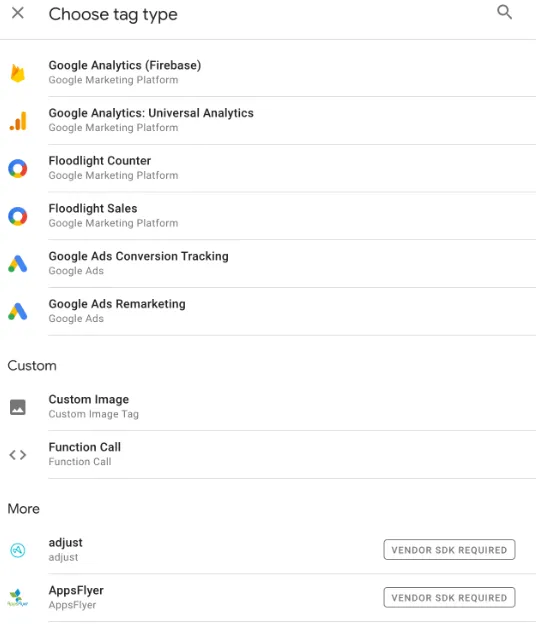
Tag options in GTM iOS container
Although GTM for websites is a powerful and convenient tool for enabling measurement without necessarily modifying the codebase, it is less useful for app tracking because of two main reasons:
- App container capabilities are limited. For example, there is no way to inject custom code into the app via the container, and only a few ad pixels are supported (as mentioned earlier).
- App containers are inconvenient from a debugging and deployment perspective. For instance, every time you make changes to your container, you need to export it, embed the exported JSON in your app, and release a new app version for your users to see the changes take effect.
Consequently, fundamental changes need to be handled in the app’s source code and most specialists agree that GTM app containers should not be the “default” choice for your tracking setup — instead, there should be a valid reason to use them. However, as you might encounter these container types in real-world situations, they have been included in this overview for your reference.
Set Up Google Analytics Tracking for Apps
The following section offers a high-level overview of implementing app tracking via the Firebase SDK and GTM for apps. As this article primarily focuses on the debugging process, and in practice, the SDK implementation is usually handled by app developers, we will not delve into the details.
Nevertheless, it is highly recommended that you set up a test app of your own. Doing so will allow you to experience the SDK implementation process firsthand, explore Firebase’s tracking capabilities, and ultimately enhance your understanding of GA4 app tracking.
Numerous tutorials are available, but this one stands out for its well-structured and easy-to-follow format:
{% include embed/youtube.html id=’X2W9MPjrIbk’ %}
Install the Firebase SDK
To set up Google Analytics tracking using the Firebase SDK, please follow these steps (more details in the official documentation):
- Create a Firebase project in the Firebase Console.
- Add your iOS app to the project by providing the app’s bundle ID.
- Download and integrate the Firebase SDK into your app by following the official documentation.
- Enable GA4 in your Firebase project settings.
- Add Consent Mode v2 to your app to have full availability of Google’s audience capabilities.
- Implement event tracking in your app’s code to track specific user actions and app performance.
Add Google Tag Manager
As GTM for apps is essentially a Firebase extension it will only work if you have the Firebase SDK correctly implemented as well. Other than that, the setup flow is as follows (more details in the official documentation):
- Add the Google Tag Manager package
- Create an iOS or Android GTM container (if applicable)
- Make modifications to your GTM workspace and publish them
- Export your container version (
.jsonfile) - Add the downloaded file to your app project
Enable GA4 event tracking
To log events for GA4, use the logEvent method provided by the Firebase Analytics SDK. This method requires an event name and, optionally, a bundle of parameters to provide additional information about the event. For example, you might log a custom “purchase” event with the required parameters like transaction_id item name, price, and currency.
// A pair of jeggings
var jeggings: [String: Any] = [
  AnalyticsParameterItemID: "SKU_123",
  AnalyticsParameterItemName: "jeggings",
  AnalyticsParameterItemCategory: "pants",
  AnalyticsParameterItemVariant: "black",
  AnalyticsParameterItemBrand: "Google",
  AnalyticsParameterPrice: 9.99,
  AnalyticsParameterQuantity = 2
]

// Prepare purchase params
var purchaseParams: [String: Any] = [
  AnalyticsParameterTransactionID: "T12345",
  AnalyticsParameterAffiliation: "Google Store",
  AnalyticsParameterCurrency: "USD",
  AnalyticsParameterValue: 14.98,
  AnalyticsParameterTax: 2.58,
  AnalyticsParameterShipping: 5.34,
  AnalyticsParameterCoupon: "SUMMER_FUN"
]

// Add items
purchaseParams[AnalyticsParameterItems] = [jeggings]

// Log purchase event
Analytics.logEvent(AnalyticsEventPurchase, parameters: purchaseParams)
{: .nolineno }
This code snippet results in a purchase event being dispatched from your app. This event will be picked up by your GTM container and you can use the “purchase” event to trigger another tag in your GTM container (s. below) and access the event parameters via built-in variables.
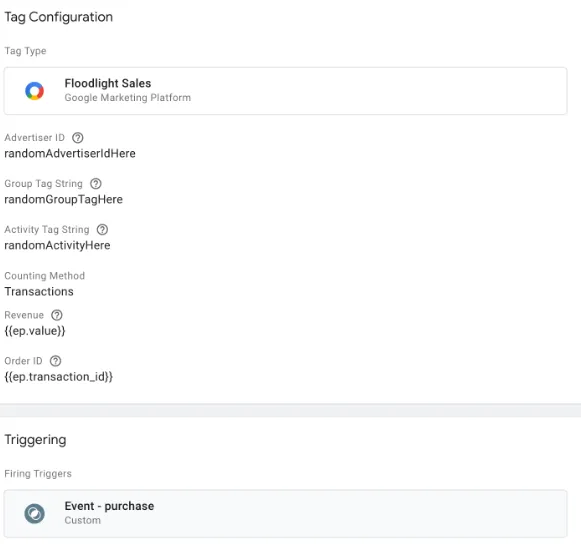
Floodlight Tag with variables from Firebase event
For a more detailed description of the setup process I can recommend working through Simo Ahava’s quickstart guides for Android and iOS.
Debugging Google Analytics Tracking for Apps
The importance of debugging Google Analytics tracking cannot be overstated, as it ensures accurate and reliable data collection, which is crucial for building trust and making informed decisions about app development and marketing strategies. By identifying and resolving issues such as missing or inaccurate data, configuration errors, and SDK compatibility, you and your stakeholders can gain a comprehensive understanding of user behavior, app performance, and areas for improvement.
In the following sections, I’ll run you through the options available. Depending on your resources and setup, I recommend choosing the most efficient one for you to debug your tagging implementation.
Debugging with the DebugView
DebugView offers a valuable resource for debugging, as it allows you to view the raw event data logged by your app on development devices in near real-time. This feature is particularly useful during the instrumentation phase of development, as it helps you identify errors in your Analytics implementation and verify the correct logging of events and user properties.
To activate the DebugView for your test iOS device, you need to specify the following command line argument in XCode:
-FIRAnalyticsDebugEnabled
To achieve this in XCode go to Product > Scheme > Edit Scheme and add the argument to the Arguments passed on Launch section.
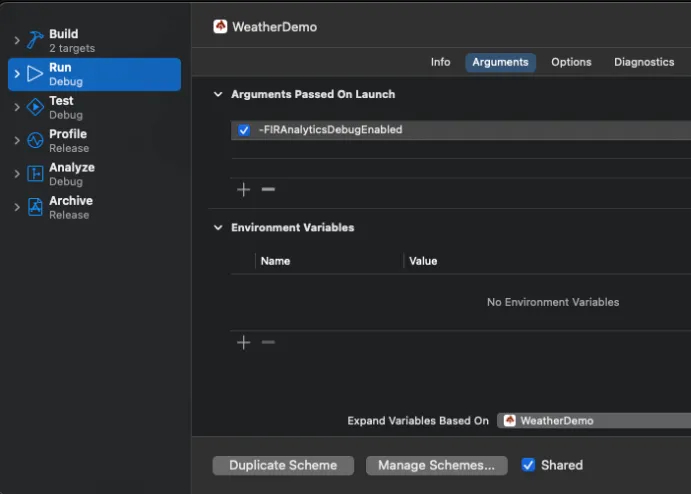
Add FIRAnalyticsDebugEnabled to XCode
Now, all events dispatched from the mobile app via Firebase will be logged and can be inspected by you. You can either view the DebugView interface in the Firebase console…
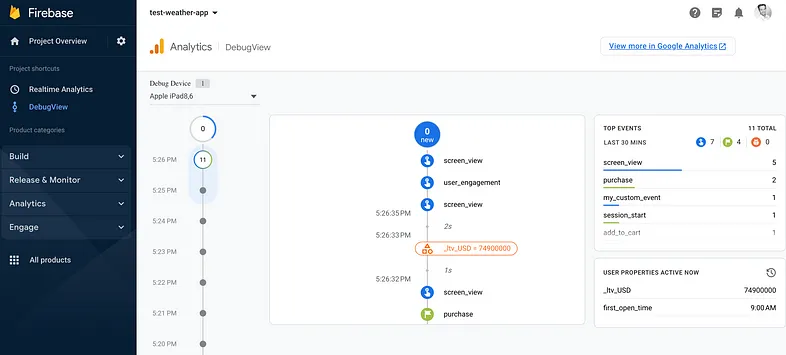
DebugView in Firebase Analytics
…or directly in the GA4 interface.
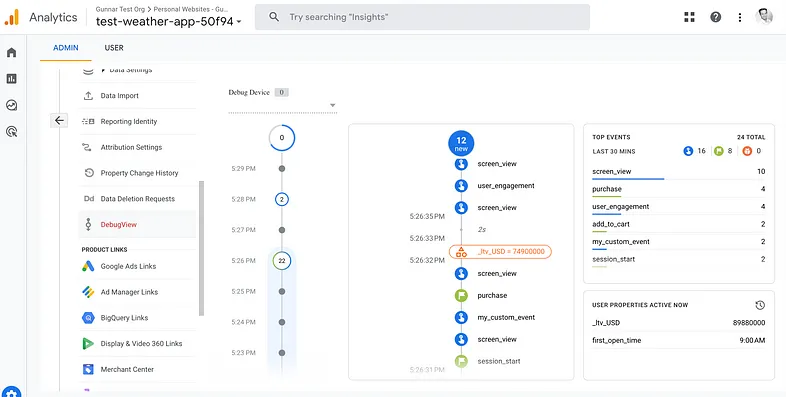
DebugView in GA4
Typically, events logged by your app are batched together over a period of approximately one hour and uploaded collectively. This approach conserves battery life on users’ devices and reduces network data usage. However, for the purposes of validating your Analytics implementation and viewing your Analytics in the DebugView report, you can enable debug mode on your development device to upload events with minimal delay. This functionality is very similar to what you experience when previewing a GA4 implementation via GTM for your website where the event batching is disabled as well to allow for better debugging experience.
Debugging with Network Proxies
Unlike web applications, where you can use a browser’s developer tools (e.g., console or network tab) for debugging, mobile apps do not offer the same level of accessibility to inspect and debug network requests. This limitation necessitates the use of proxy tools, to intercept and inspect network traffic, including Google Analytics requests, between the app and the server. The general functionality of such proxy tools and how they fit into the debugging process can be seen here:
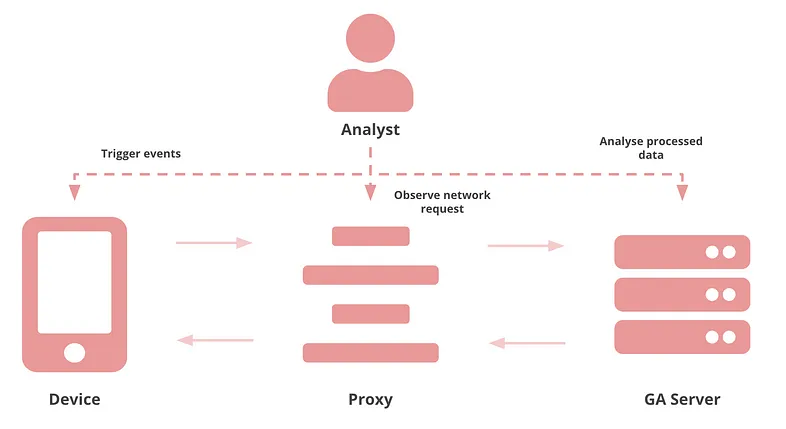
Debugging process with network proxy
- Device: This is your mobile app or any other client-side application that sends requests and receives responses from the internet.
- Proxy: This is the debugging proxy that acts as an intermediary between your mobile app and the internet. It captures, monitors, and analyzes network traffic, allowing you to inspect, modify, and record requests and responses.
- Server: This represents the server-side components, such as APIs, websites, or other web resources that your mobile app communicates with.
When you use such a proxy, the network traffic between your app and the internet is routed through the proxy. This allows you to intercept and display all the requests, their payloads, and responses in real-time, giving you a clear view of the data being sent and received by your app.
The following tools utilize the process described above and will help you make this task much easier and ensure high data quality for your business stakeholders.
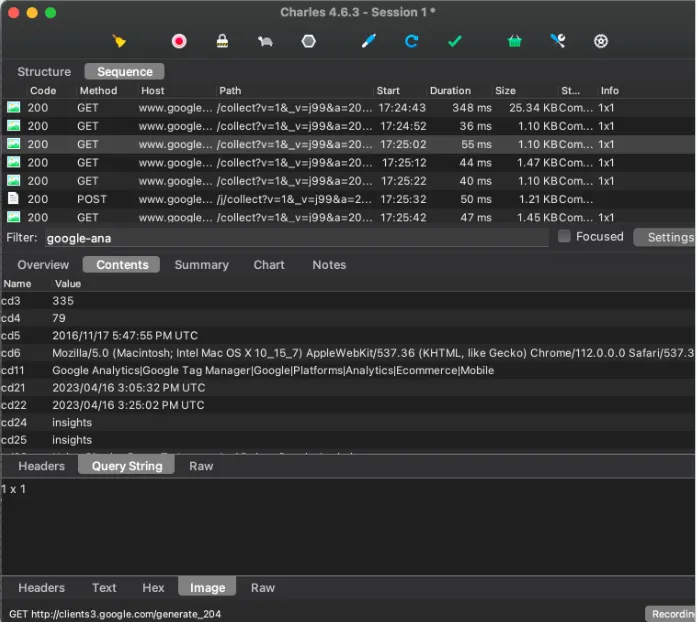
Charles Proxy
Charles Proxy is a web debugging proxy that allows you to monitor and analyze network traffic between your app (and any other device really) and Firebase Analytics. It’s an invaluable and free tool for identifying issues with tracking implementations, such as missing or malformed events and incorrect configuration.
In the following section, I will describe how to set up the tool to use it successfully and efficiently for debugging app tracking. Please note that the examples provided are for MacOS and iOS. While the general process is similar for Windows and Android, some specifics differ.
Set up Charles Proxy
To set up Charles Proxy and enable the application to intercept requests from a mobile app on your phone, please follow these steps:
- Download Charles Proxy here.
- Ensure that your iPhone and Macbook are on the same network
- In Charles: Help > SSL Proxying > Install Charles Root Certificate on a Mobile Device or Remote Browser (follow the instructions on the screen)
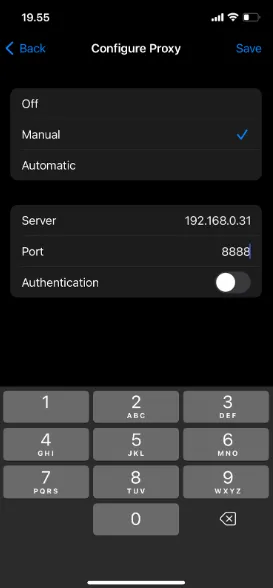
4. Configure the network connection
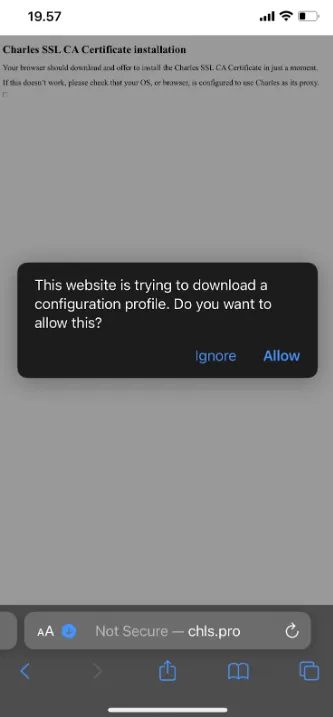
5. Download the CA Root SSL certificate
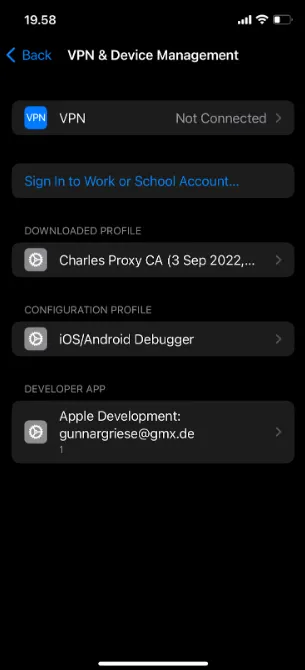
6. Install the certificate on your device
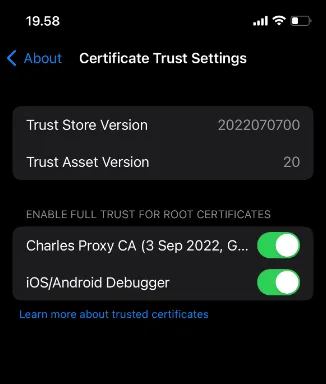
7. Trust the certificate
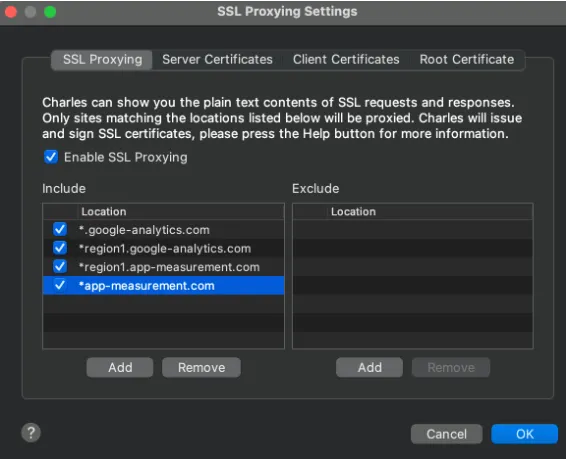
8. Decrypt requests sent over SSL: Proxy > SSL Proxying Settings… > .google-analytics.com (or your sGTM endpoint); .app-measurement.com
9. Decrypt requests sent over SSL: Proxy > SSL Proxying Settings… > .google-analytics.com (or your sGTM endpoint); .app-measurement.com
Now you are able to intercept and analyze all outgoing requests from your mobile app.
Debug Native Mobile Apps
The Firebase SDK sends GA4 events to its own servers (app-measurement.com) in a format that is challenging to interpret.
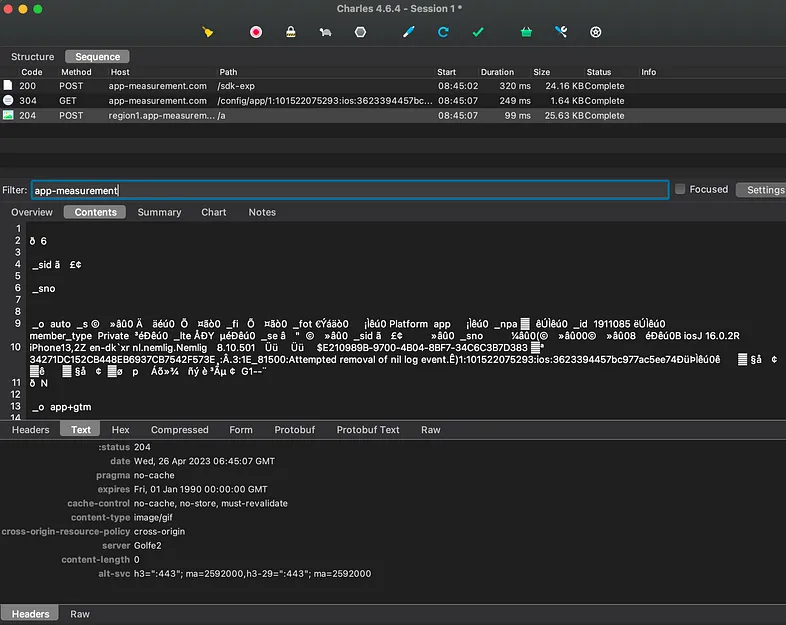
Encoded protobuf payload
Initially, the raw data appears as a series of random characters. It may seem like the content is encrypted, but Firebase actually uses Protocol buffers (“Protobuf”), a Google-developed mechanism for serializing structured data.
Charles supports Protobuf out of the box, allowing you to right-click on the request and select View Request As / Protocol Buffers… to decode the data.
While the data is now more readable, it is still missing substantial information. Protobuf compresses data by replacing lengthy key names with numbers, with the mapping defined in a .proto file needed for both writing and reading Protocol buffers.
Unfortunately, the .proto definitions required for decoding are not made publicly available by Google. However, Lari Haataja did a great job by examining the encoded data and correlating information from other sources, and reverse engineering the names of most keys in the data structure. Check out his accompanying blog post here.
Lari published the results of his research on his GitHub repository, ready for your use in Charles Proxy.
To add them to your Charles Proxy configuration, open “Viewer mappings…” from the menu and add a new mapping. Add the app-measurement.desc file from Lari’s GitHub repo to the Descriptor Registry and then create a new mapping for app-measurement.com requests with the following settings:
- Request type: Protocol Buffers
- Message type: app_measurement.Batch
- Payload encoding: Binary & Unknown
Now, viewing the Firebase requests displays more comprehensible values:
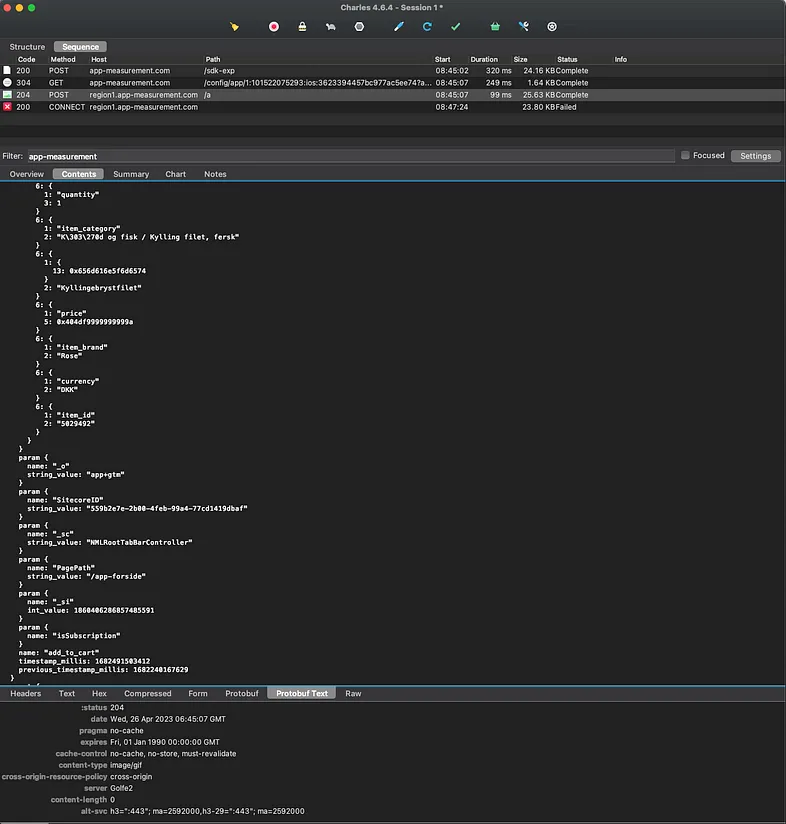
Decoded protobuf payload
Debug WebViews
WebViews are embedded browser components within a native mobile app, allowing developers to display web content and run web-based applications directly within the app. They bridge the gap between native mobile apps and web content by providing a seamless user experience.
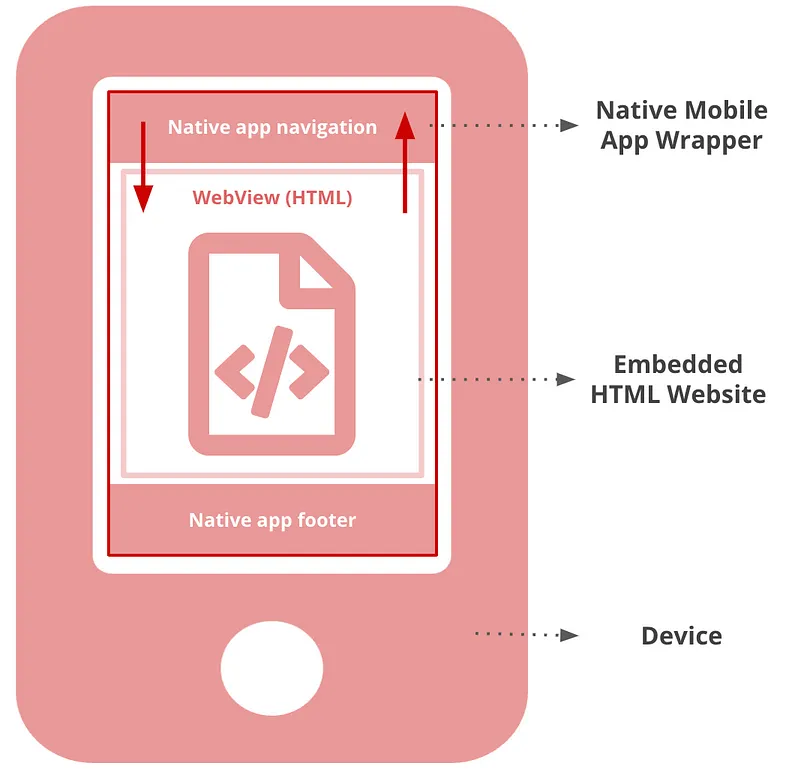
Schematic of a WebView
Unlike native mobile apps, which are built using platform-specific programming languages like Swift for iOS or Kotlin for Android and have direct access to device features, WebViews rely on HTML, CSS, and JavaScript to create an app-like experience within the native app. While native apps can deliver better performance and tighter integration with the device’s hardware and software features, WebViews can be a cost-effective solution for developers seeking to leverage existing web-based content or simplify cross-platform development. As they are different types of app — a hybrid so to speak — the difference mainly lies within the way the Firebase Analytics SDK is implemented and not so much in the debugging process.
In order to implement Firebase Analytics SDK in a WebView app, you’ll need to follow a series of steps that involve forwarding events and user properties from the WebView to the native code before sending them to Google Analytics.
- Create JavaScript functions: Start by creating JavaScript functions that forward events and user properties to the native code. This should be done in a way that is compatible with both Android and Apple native code.
- Implement native interface: For Apple devices, create a message handler class that conforms to the WKScriptMessageHandler protocol. Within the userContentController:didReceiveScriptMessage: callback, implement Firebase calls.
- Add the message handler: Add the message handler to the WebView’s user content controller to enable communication between the JavaScript and native code.
Follow the instructions provided in the Firebase Analytics WebView sample to integrate Firebase Analytics in a WebView inside an Android or iOS app.
Again, using this approach you will be able to use all the debugging tools outlined in this blog post. Just be aware that there is an additional data exchange taking place between the embedded browser and the native app components.
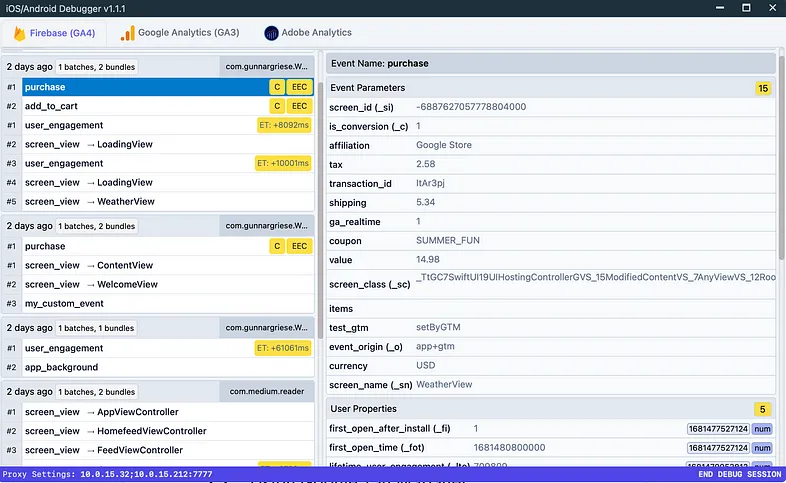
iOS/Android Debugger
iOS/Android Debugger is an application designed by David Vallejo specifically for debugging Google Analytics tracking in mobile apps. It enables you to view real-time data sent to Google Analytics, validate event tracking implementation, troubleshoot common issues, and comes with the following features:
- Firebase (GA4) — The Debugger enables real-time viewing of event batches, including auto-generated events like session_start, app_background, etc., along with event parameters, user properties, audiences, and other internal payload data.
- Google Tag Manager (Android only) — This work-in-progress report allows users to see which containers are loaded, which events are triggered, and the list of variables being evaluated. Note that this report is not app-based and will display all hits from the currently connected device.
- Adobe Analytics (iOS only) — Users can view hits fired to any account with a clear overview of the current event name and page name.
- Google Analytics (UA) — Familiar to most users, this report displays Universal Analytics (GA3) hit payloads. Note that this report is not app-based and will display all hits from the currently connected device.
The setup of the iOS/Android Debugger is smooth — especially compared to Charles Proxy:
- Download the application from the dedicated website
- Open the application
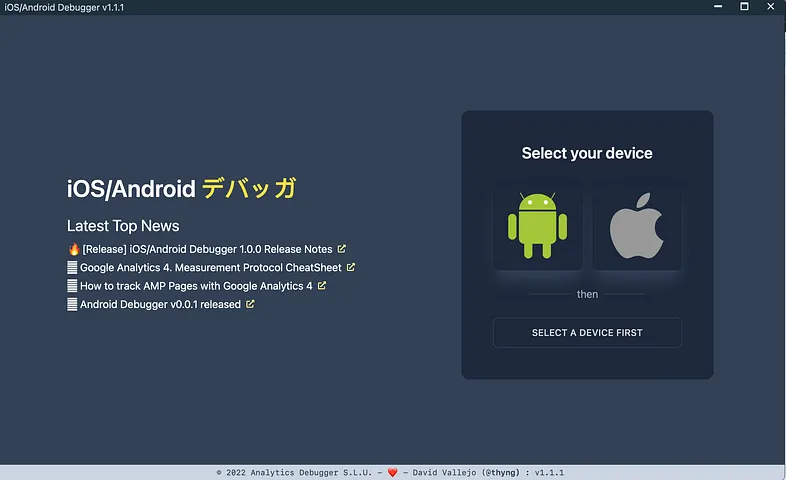
3. Select a device to debug > Start Debug Session
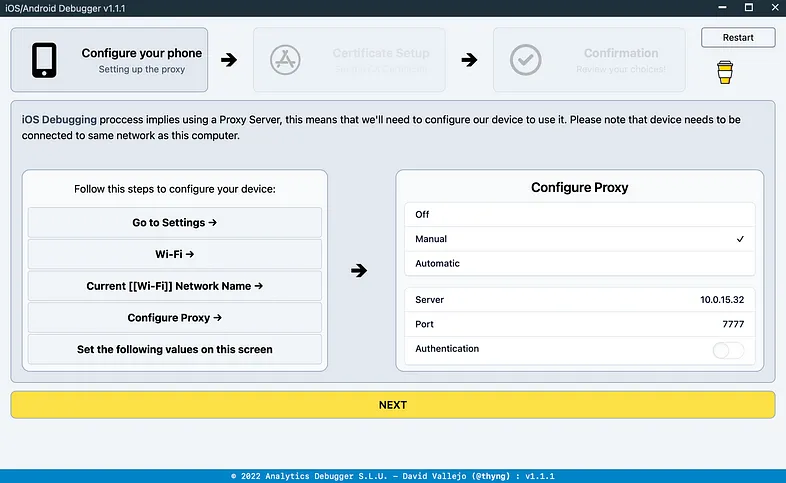
4. Configure your device and set up the proxy
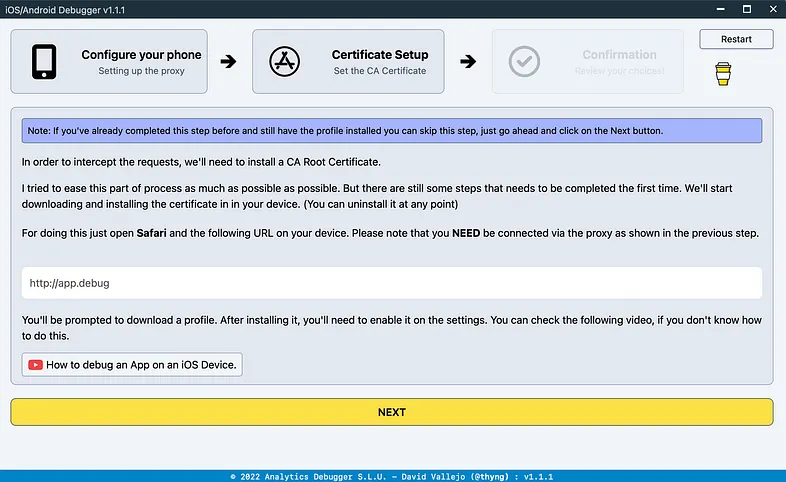
5. Downloading and installing the CA Root Certificate (s. Charles Proxy steps)
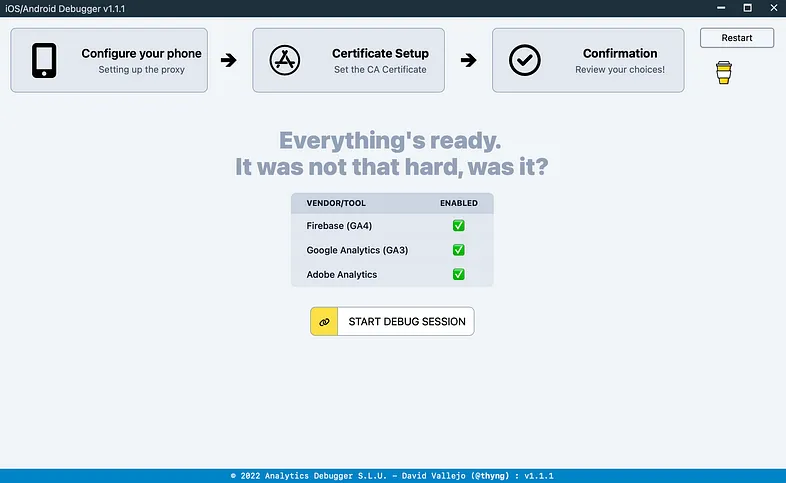
6. Start your debugging session
Upon completing the setup, launch the desired mobile app on your phone and navigate within the app to trigger the Firebase events you wish to debug. Wait for these events to appear on the application’s screen. The Debugger will display a sequence of events as they are registered by the proxy. By selecting a specific event, you can inspect all associated event parameters and user properties.
7. View the requests sent to Google Analytics
Other Network Proxies
Apart from Charles Proxy, there are several alternative tools that offer similar capabilities for inspecting network traffic and debugging mobile apps. Fiddler is a versatile web debugging proxy that provides comprehensive network monitoring and manipulation features. Proxyman is another powerful option that simplifies the process of intercepting and editing HTTP/HTTPS requests and responses on macOS, iOS, and Android devices. Lastly, HTTP Toolkit offers an open-source solution for debugging, testing, and building with HTTP(S) on Windows, macOS, and Linux. Each of these tools operates in a similar manner, allowing you to intercept network traffic, analyze requests and responses, and gain insights into your app’s behavior, making them valuable alternatives to Charles Proxy for mobile app debugging.
BigQuery Real-Time
GA4 offers real-time streaming of raw data into BigQuery, allowing you to access granular information for debugging your tracking implementation. To utilize this feature, follow these steps:
- Link GA4 to BigQuery: Ensure that your GA4 property is connected to a BigQuery project. To do this, navigate to the “Admin” section in GA4, click on “BigQuery Linking” under the property column, and follow the steps to link your GA4 property to the desired BigQuery project.
- Configure real-time export: Once the connection is established, enable real-time export to BigQuery by selecting the “Stream data to BigQuery in real-time” option in the linking settings.
- Access real-time data in BigQuery: After enabling real-time export, navigate to your BigQuery project and look for a dataset named
analytics_<your_property_id>. Within this dataset, you will find a table namedevents_intraday_<datetoday>that stores the raw event data streaming from GA4 in real-time. - Run queries for debugging: With the real-time data in BigQuery, you can now run SQL queries to analyze and debug your tracking implementation. For example, you can check the occurrence of specific events, validate custom parameters, or identify discrepancies in the data. This real-time access to raw data enables you to quickly identify and fix issues in your tracking setup.
- Monitor and optimize: Continuously monitor the data stream and refine your queries to improve your tracking implementation. Be sure to address any discrepancies or issues you uncover during the debugging process.
By utilizing GA4’s real-time data streaming into BigQuery, you can effectively debug your tracking implementation and ensure accurate data collection for your app or website.
Conclusion
Debugging Google Analytics tracking via Firebase for iOS apps can be challenging, particularly for beginners. This blog post aims to provide you with the necessary tools and understanding to confidently tackle mobile app tagging debugging. A thorough grasp of Firebase’s capabilities and limitations is essential for effectively navigating and leveraging the ecosystem.
Debugging app tracking is notably distinct from debugging for the web. To develop proficiency in mobile app development, it’s crucial to acquaint yourself with its unique characteristics and adapt your approach accordingly.
By adhering to the steps presented in this guide, you’ll be well-equipped to debug and maintain Google Analytics tracking in your mobile app, yielding valuable insights into user behavior and app performance. Happy debugging!


")


