When it comes to data analytics, it is crucial to make sense of data by finding valuable patterns and conveying insights to the right people at the right time. Many analysts use tools to support each step of the journey, with the final output often being a visualization in the form of reports or dashboards. These dashboards help businesses and management understand current KPI developments and inform on which actions or decisions to make.
One visualization tool that we at IIH Nordic use frequently internally and externally is Looker Studio, formerly known as Data Studio. Looker Studio is a powerful dashboarding tool that can be utilized at every step of the journey from early data exploration to end-user story telling along with date-to-day utilization.
Key Features of Looker Studio
- Ability to integrate and connect to a variety of data sources, such as Google Analytics or Google Ads along with modern data warehouses and platforms outside of the Google Suite.
- Ability to combine data across data sources, allowing for a more holistic view of patterns, trends and user behavior
- Quick insights with out-of-the-box visualization frameworks that are interactive and customizable like charts, graphs, geographical maps, heatmaps and more.
- Easy to share insights/reports with individuals or groups.
- Ability to invite others to collaborate and edit reports.
Trends in Data Analytics
A trend we see within data analytics and in businesses at large, is the move towards self-service and democratization of data. Companies are increasingly looking for ways to empower their employees to explore and understand their data, rather than relying on a small team of data scientists or analysts. Looker Studio helps support this trend with its user-friendly interface and simple, intuitive visualization options. This makes it easy for non-technical users to explore and understand their data.
Current Limitations with GA4 quota
One of the most utilized connectors for Looker Studio, is directly to Google Analytics. Creating customized reports to gain deeper insights into website traffic and online user behavior has a tremendous business value. However, during the transition from Data Studio to Looker Studio a quota system native GA4 connections in Looker Studio was introduced. The quota is used based on the number of users accessing a report, the number of visualizations in a report, and the complexity of data being used in the report. This impacts users who have complex dashboards with many elements by creating unloadable reports when the quotas are exceeded.
A recommended solution from Google is to reduce the number of elements used and to rethink what dimensions and metrics should be displayed, but this may not be applicable for all businesses as many have complex reporting needs or large volumes of data.
Other solutions are to use data warehouses, such as BigQuery, to store the GA4 data and then use the BigQuery connector from Looker Studio instead. While this solution removes the quota constraint, it requires strong SQL knowledge to process the data before it is ready to be used in Looker Studio.
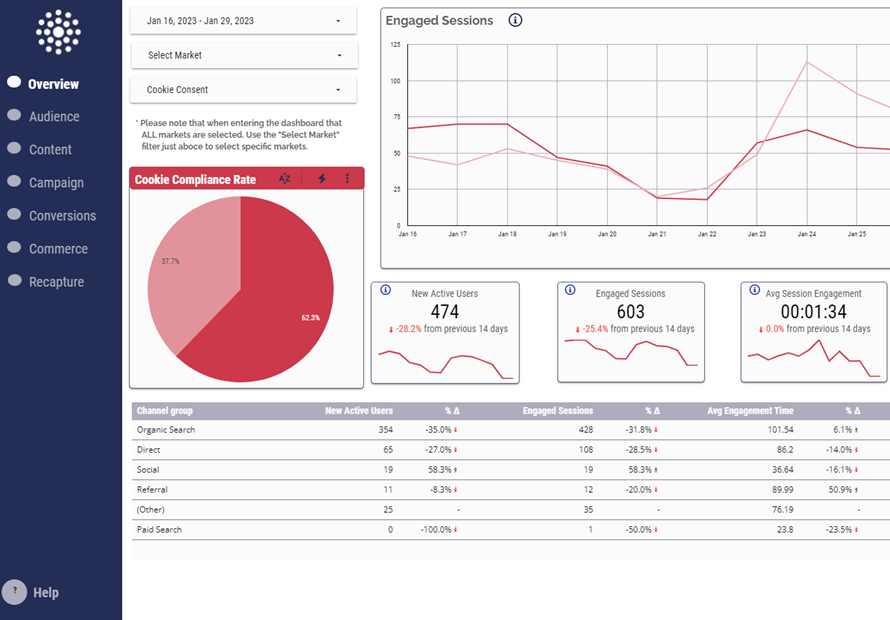
To accommodate this shortcoming and to retain the business value we at IIH Nordic have created the “GA4 Analytics Hub” product, with a ready to use Looker Studio dashboard. This standardized dashboard includes dimensions and metrics from GA4 that from our experience we recommend businesses should be tracking, definitions of new GA4 terminology, and easy to understand graphics and visualizations.
Please get in contact with us if you are interested in learning more about this product.


